Today, roughly 20 years ago, the chart for stock PNW made a big move. What could have caused it? There could be a billion good reasons. We at NoisyStocks have no idea what those reasons are. Instead of a careful & nuanced analysis, we have calculated this chart using a special throw-spaghetti-at-a-wall-and-see-what-sticks algorithm. Our marvelous approach takes random variables and makes wildly spurious correlations.
PNW and rainfall in Kaputian
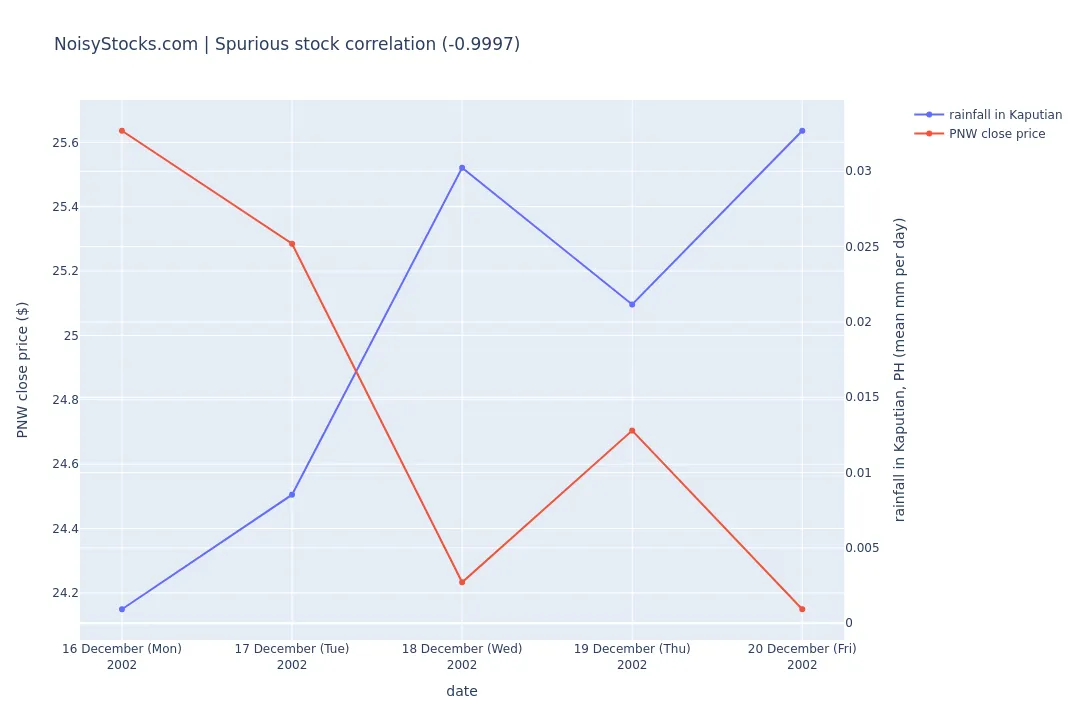
The spurious correlation between stock PNW and rainfall in Kaputian
Credits: Rainfall GPM IMERG dataset by NASA downloaded via Copernicus, Historical stock price dataset by Boris Marjanovic downloaded via Kaggle, Cities dataset from GeoNames